Josh Hazlewood believes averaging 35 in Australia today could be as good as averaging 45 a decade ago, but has batting really become that much harder? Sarah Waris explores.
It’s a commonly held notion that batting in the modern era is following two extremes: scores are on an upswing in T20 cricket, where the sky is no longer the limit, while batting in Test cricket has gone in the opposite direction with low scores, balls moving off the pitch, and batters repeatedly beaten.
Josh Hazlewood’s recent comments offered one view on the changing nature of batting in the format today: “Averaging 35 with the bat is potentially the same as averaging 45 ten years ago. I think the wickets have changed that much.”
His quote has merit because he has been a part of this change and seen it up close. And if there is one place where the shift is most apparent, it is Australia, where batting has become increasingly difficult, as compared to the rest of the world.
Since 2022, four of the last 20 Tests played in the country have finished inside two days: Against South Africa at Brisbane in 2022, against England at Perth and Melbourne during last year’s Ashes, and against Bangladesh at Mackay this year. Before 2022, Australia had seen a Test end in two days only once, against West Indies in Melbourne in 1931.
However, four extreme matches do not, by themselves, prove that batting has fundamentally changed. The more revealing evidence comes from the numbers across an entire season.
And they largely agree with Hazlewood.
The decline is not just a feeling
The Sheffield Shield provides the biggest indication. Across the 2010s, the competition's batting average was 29.19, rising to 32.25 in 2014/15, with a strike rate of 50.71. By 2023/24, it had fallen to 25.87, rebounding slightly to 26.01 last season, with a strike rate of 49.40.
The Shield has lost more than six runs from its batting average between those two seasons, but only 1.31 points from its strike rate. The change, then, is much more pronounced in how often batters are getting out than in how quickly they are scoring.
The Test numbers in Australia are even more striking.
Test batting averages in Australia peaked at 43.49 in 2015, but had fallen to 33.15 by 2019 and have continued to fall since. The strike rate, meanwhile, has fluctuated rather than followed the same sharp decline. It is therefore not simply a case of the batters becoming more attacking, as is the commonly held belief. They are, in many seasons, scoring at similar rates as before, but the same scoring intent is producing fewer substantial innings.
The Shield tells us where the change is happening
In 2014/15, the Shield's overall batting average was 32.25, the highest it has been in a season since 2010/11. The first-innings batting average was 33.20, second innings 38.59, third innings 26.39 and fourth innings 27.21. It showed the familiar pattern of batting becoming harder as matches progressed.
In the 2024/25 season, those numbers were 27.76, 27.46, 32.18 and 28.12 respectively, almost the opposite pattern, with batting now tougher at the start and easing up as the match progressed.
The overall bowling averages have also changed, from 33.76 in 2014/15 to 26.96 last season.
That is a nearly seven-run improvement for bowlers occurring alongside a six-run decline in the batting average. The result is simply fewer runs being scored for each dismissal.
A further indication comes from how the top batters fared in each season. In 2011/12, Ed Cowan was the leading run-scorer with 948 runs at 59.25, with seven of the top 10 run-scorers that season averaging over 45. Last season, none of the top ten could average more than 36.50, with no batter crossing 725 runs.
So, have the good batters totally disappeared, or is there merit to Hazlewood’s claim that an average of 35 is the new 45?
The first 30 overs may hold part of the answer
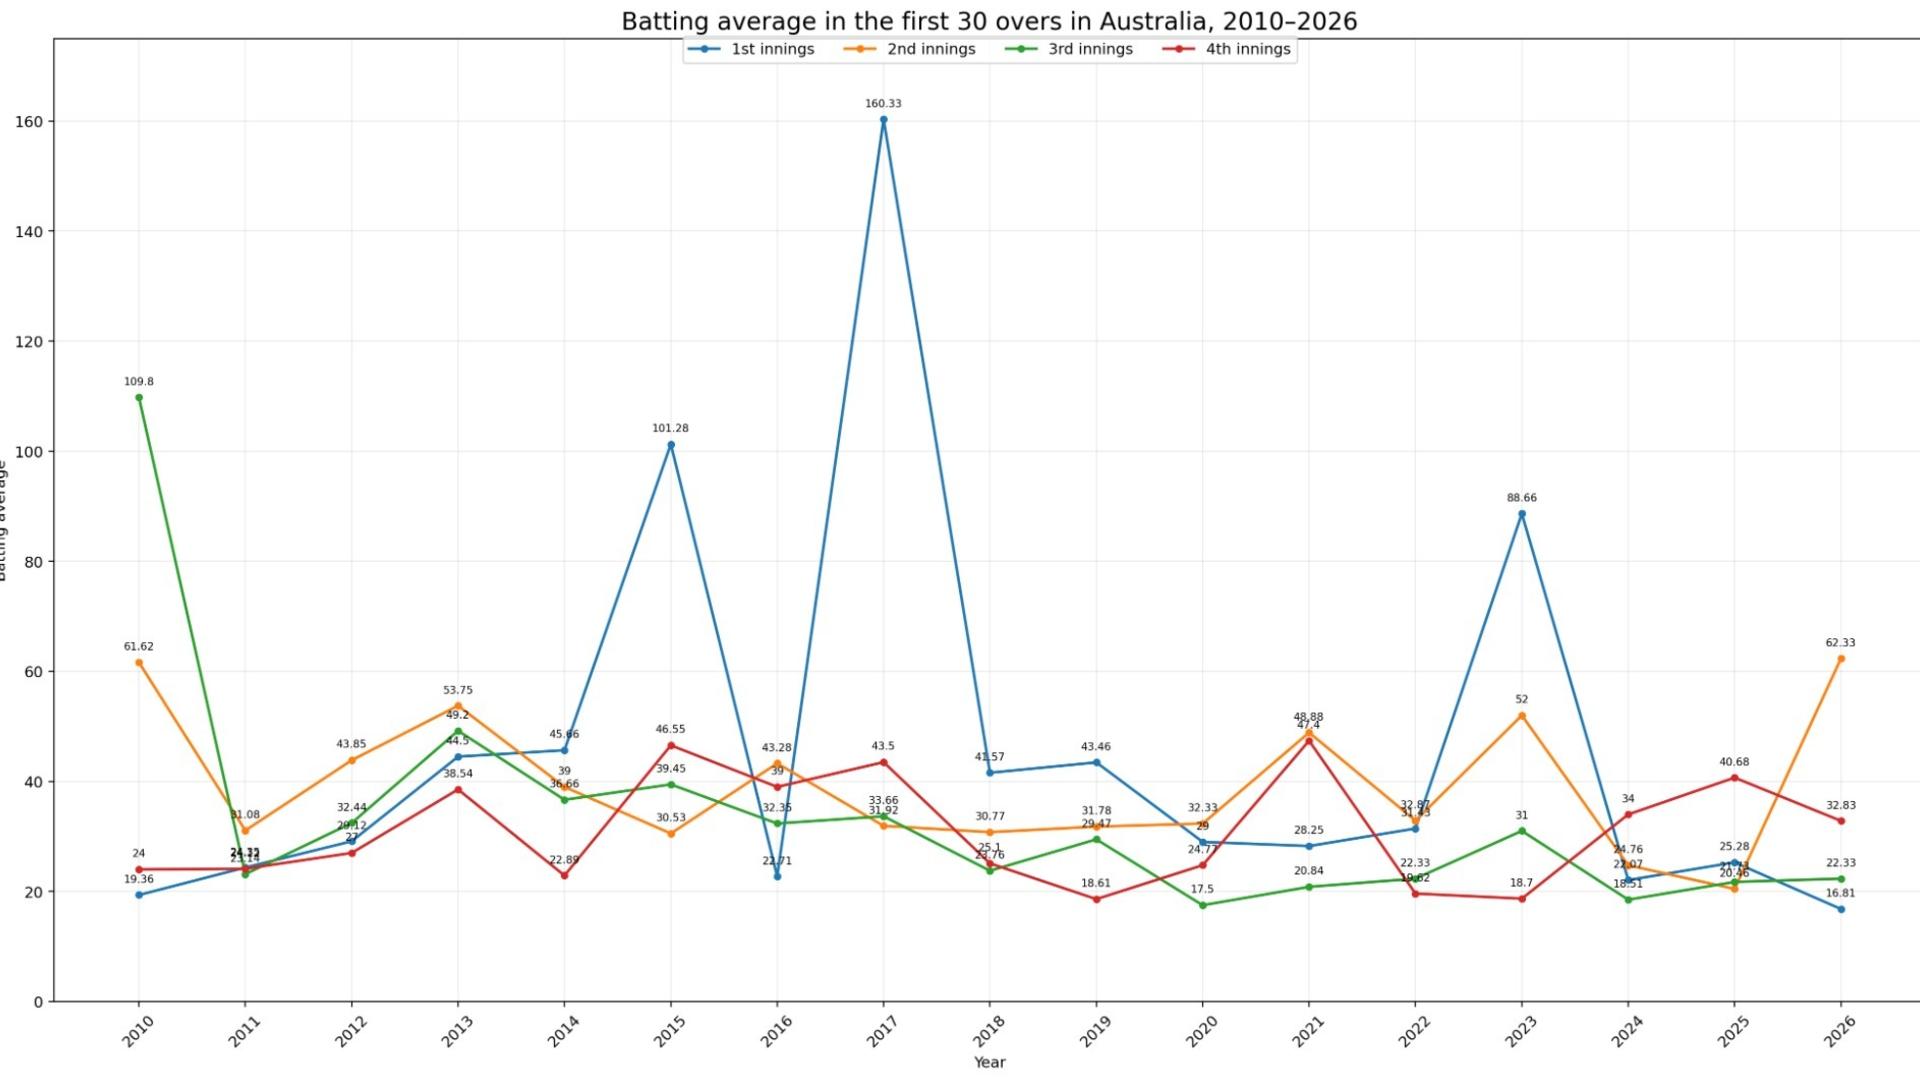
The clearest shift can be seen in the returns of the first 30 overs of a Test innings in Australia. After several seasons where batters averaged well into the 40s, and even crossed three figures in outlier years like 2015 and 2017, recent Australian summers have looked very different. According to Cricviz, in the last three seasons, teams have struggled to average 25 in the first 30 overs of the first innings, when the ball is hard, the seam is pronounced, and the fast bowlers are at their freshest.
Hazlewood touched upon the use of the Kookaburra, while Steve Smith has also spoken about how the redesigned ball, introduced after 2020/21, has made batting harder particularly during the first 30 overs. “I think since 2021, when they changed the Kookaburra ball, batting has got more difficult. At the same time, wickets have got greener, so it's the perfect storm. I think particularly the first 35 overs of an innings are very challenging at the moment with the significant seam movement.”
The data cannot prove that the Kookaburra alone caused the decline. Pitches have changed at the same time, and the bowling has improved. But the timing is notable: the sharpest decline in batting has come during the same period in which players have spoken about the ball becoming harder to survive against.
It is not just the ball. The attacks are better
All five of the last five Test series in Australia have seen opposition bowling averages below 35. In the 2010s, only four teams averaged less than 35 in a series Down Under, out of 17 tours.
Overall, the pacers averaged below 30 in 39% of a Test series (min. two matches) in the 2010s; since 2020, that figure has risen to 54%, pointing to a broader improvement in pace-bowling quality.
Between 2010 and 2020, the opposition new-ball quicks averaged 32.15 in Australia in Tests, while the rest of the pacers (third-change onwards) averaged 37.88. This decade, the pacers who have taken the new ball average 30.27, but the main difference has come in how the other seamers are responding: the rest of the pacers average 30.72, suggesting more all-round attacks, better quality throughout the bowling group and, perhaps, some help from the changing wickets.
The significance is that the threat no longer necessarily disappears once the opening pair are removed, giving batters fewer opportunities to cash in once the new ball has softened.
Australia's best batters have adapted
Australia’s batters have not been immune to the changing conditions. Between 2010 and 2019, nine Australian players scored at least 200 runs and averaged over 50 in home Tests. Since 2020, Head is the only one who averages over 50, followed by Smith at 47.32. Marnus Labuschagne is the only other to average over 45. Overall, their team batting average has fallen 7.3 per cent, from 34.11 in the 2010s to 31.63 since 2020.
However, that fall is considerably less than that of India (14.5 per cent) and South Africa (17.8 per cent) over the same period. Teams like England (3.7 per cent) and Pakistan (6.9 per cent) have had smaller declines in batting average, but those teams have struggled to win matches. In contrast, while Australia’s batters have seen their numbers decline, they haven’t regressed as much as their opponents.
Since 2020, Australia have averaged 31.63 runs per wicket, compared to 24.13 for their opponents, a difference of 7.50 runs. It has pushed up their win/loss ratio in Tests from 1.50 in the last decade to 2.916 in the 2020s. No other team has a win/loss ratio of over 2 in the last six years.
Their individual averages may no longer resemble those of the previous decade, but Australia have remained considerably more productive than the others. They have had fewer batters producing exceptional averages, yet enough quality and consistency across the order to maintain their dominance.
There is, then, some merit in Hazlewood’s assessment. Batting averages in Australia have fallen sharply, both in the Sheffield Shield and in Test cricket, showing that scoring runs has become harder.
Australia’s own batters have seen their averages fall too, with far fewer players reaching the numbers that were common in the 2010s. But their decline has been smaller than that of several of their opponents, still managing to stay ahead of them.
An average of 35 may not literally be the new 45, but in the current conditions, it can mean much more than it did a decade ago.
Follow Wisden for all cricket updates, including live scores, match stats, quizzes and more. Stay up to date with the latest cricket news, player updates, team standings, match highlights, video analysis and live match odds.